By Gene Balas, CFA®
Investment Strategist
No matter which measure you prefer to use for measuring how expensive the U.S. stock market is, stocks are much more richly valued right now than at most other times in history. In fact, we can examine how expensive markets currently are using any number of different metrics.
As one measure, we can compare the total value of companies traded in the U.S. to the aggregate size of the U.S. economy. Alternatively, we could look at broad market indices to either compare stock prices to the earnings per share of those companies, as measured by the Price to Earnings (P/E) ratio; compare stock prices to the sales (i.e., revenues) of those companies, as measured by the Price to Sales (P/S) ratio; or compare stock prices against the book value (i.e., net worth) of a company, as measured by the Price to Book (P/B) ratio.
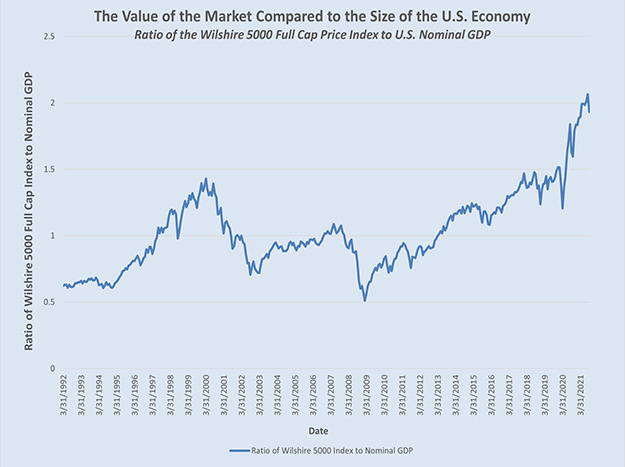
Source: Bloomberg and U.S. Bureau of Economic Analysis
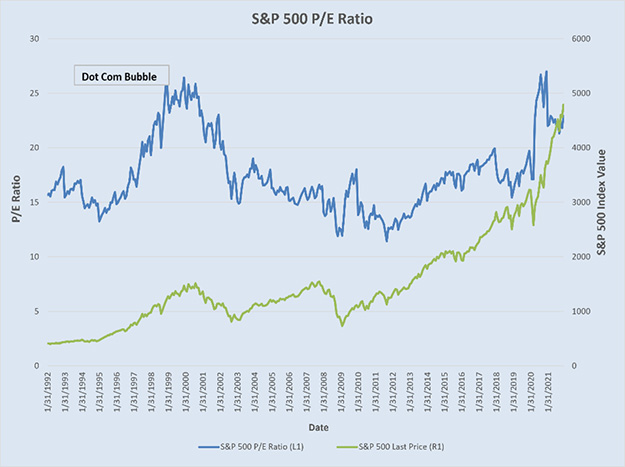
Source: Bloomberg
The above graphs illustrate a couple of these more common measures. But each clearly indicates that investors must pay a greater premium for a share of stock relative to what a company earns, what it sells, and what it owns.
While the valuation of the market isn’t necessarily a good market timing gauge in and of itself—there generally must be some sort of catalyst for share prices to take a tumble—and stocks at high prices have considerably further to fall during a market correction (and less room to rise during economic expansions).
Look beyond the obvious
But as an investor, you don’t really need to buy the entire market; instead, you can select focus on certain segments of the market where prices may not be so elevated. In the graph below, returns of the S&P 500® index (which weights each stock according to its market capitalization) are plotted relative to the S&P 500 Equal Weighted index (which gives each stock the same representation in the index). When the headline measure outperforms the equal weighted measure, that means that the biggest companies in that index are playing a greater role in driving the market returns higher, while the smaller components in the S&P 500 have lagged.
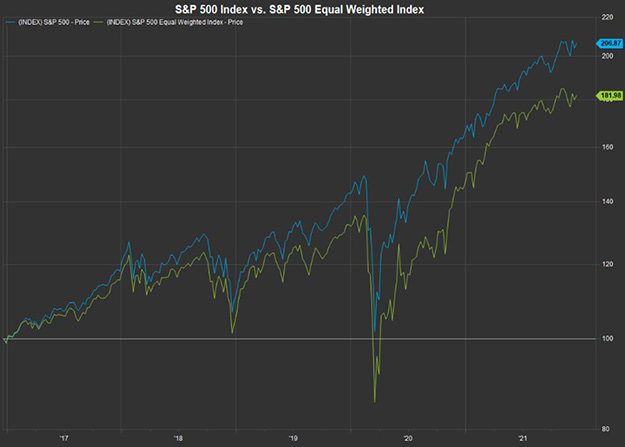
Source: FactSet
Certainly, this will come as no surprise to those who have followed the massive ascent in share prices of some of the largest—and often fast growing—tech-related companies, which now dominate investor interest. There are plenty of other stocks, however, that haven’t quite attracted investors’ dollars.
These lesser-invested and less expensive areas of the market include smaller and mid-sized companies (as we alluded to in the discussion about the equal-weighted vs. capitalization-weighted index returns), as well as value stocks. And different sectors of the market can also present potential opportunities versus investing either in the broad market or in the most popular (and pricey) areas of the market.
Yes, new technologies do have the potential for making our lives more comfortable and more convenient. But the question is, how much of their future potential earnings are already priced into the stock? The answer is, probably quite a lot. There’s only so much more that a tech company’s customer base can expand, or its profits can grow; after all, trees don’t grow all the way to the sky. Likewise, paying expensive prices now could limit your price gains in the future – even if the markets don’t actually take a tumble.
Other considerations
While there are a host of other sectors besides technology and tech-related companies, we should first note a few caveats. One is the fact that the Federal Reserve has indicated it will begin to tighten monetary policy in coming periods. There’s a risk, therefore, that interest rates all along the yield curve could rise.
For stocks whose value comes at least partly from paying generous dividend income, more attractive yields on bonds often means investors may also demand higher dividends from these stocks—leading to lower prices. Rising yields can affect stocks in utilities, consumer staples, and real estate, among others. These are all sectors that are usually thought of as ‘defensive,’ or less economically sensitive.
Other stocks and sectors vulnerable to rising inflation include companies with smaller profit margins (especially those with labor costs as a high percentage of their total cost structure). Certain consumer-oriented companies may be vulnerable in this regard, especially if they can’t pass along all their cost increases to customers.
There is one sector, though, that marches to the beat of its own drummer, and whose member companies may profit from a variety of factors that aren’t directly linked to the broad economy—and that’s Healthcare. Some of these companies may have more immediate wins from developing new pharmaceuticals or biotech products. Others, meanwhile, may capture the effects of longer-term demographic trends—such as that of an aging population and the attendant greater demand for health care services, whether from hospital systems, care facilities, or medical devices.
These are but a few examples of how you might want to consider redeploying your portfolio allocations in response to current high stock valuations. Most importantly, not all of them necessarily require significantly reducing your portfolio’s overall equity allocation. One idea, as we mentioned, includes shifting funds from large- and mega-cap companies to small- and mid-cap companies. Or you may want to consider shifting your emphasis from growth stocks to include a larger allocation to value stocks. Lastly, remember to be thoughtful about the different opportunities and risks associated with various sectors. Perhaps it’s time to pare back your tech stock holdings a bit and add more healthcare stocks. There are plenty of other ideas to consider as well.
Everyone is different, with different personalities, objectives, and risk parameters. In the end, your portfolio needs to help you accomplish your long-term goals—and that has nothing at all to do with whatever stock just made a record high today.
Sources: S&P 500 Index returns and the S&P 500 Equal-Weighted Index returns are supplied by FactSet. Nominal U.S. GDP is reported by the U.S. Bureau of Economic Analysis. The FT Wilshire 5000 Full Cap Index returns are provided by Bloomberg. The P/E Ratio of the S&P 500 Index is supplied by Bloomberg.
Definitions: The S&P 500 is an index of the stocks of 500 leading companies in the US economy, which provides a gauge of the U.S. equity market. The FT Wilshire 5000 Full Cap index measures the performance of all actively traded public US companies and is designed to give an unbiased and complete gauge of the broad market. Gross domestic product (GDP), the featured measure of U.S. output, is the market value of the goods and services produced by labor and property located in the United States.
For details on the professional designations displayed herein, including descriptions, minimum requirements, and ongoing education requirements, please visit www.signatureia.com/disclosures. Signature Investment Advisors, LLC (SIA) is an SEC-registered investment adviser; however, such registration does not imply a certain level of skill or training and no inference to the contrary should be made. Securities offered through Royal Alliance Associates, Inc. member FINRA/SIPC. Investment advisory services offered through SIA. SIA is a subsidiary of SEIA, LLC, 2121 Avenue of the Stars, Suite 1600, Los Angeles, CA 90067, (310) 712-2323, and its investment advisory services are offered independent of Royal Alliance Associates, Inc. Royal Alliance Associates, Inc. is separately owned and other entities and/or marketing names, products or services referenced here are independent of Royal Alliance Associates, Inc.