By Gene Balas, CFA®
Investment Strategist
Why is striving to always be in whichever stocks are hot (until they’re not) a mistake? By extension, the answer to this question also applies to what drives the performance of most major stock indices— including the S&P 500®. So, let’s take a closer look.
First, most major indices give the largest companies by market capitalization proportionally more weight in the index than smaller companies. When the market is dominated by a small group of very large companies, however, the performance of those larger companies counts for far more than the performance of their smaller peers.
In fact, according to S&P Dow Jones indices, the top ten companies in the S&P 500 currently make up around 30% of the index’s value. Apple alone now comprises over 6% of the index! In other words, currently 495 of the 505 companies in the S&P 500 combined drive less than 70% of the index’s performance calculation.
As a given company’s share price powers higher (and the bigger it gets), the more influence it has on the returns of the underlying index. This tends to significantly skew the returns of the headline ‘capitalization weighted’ index measure to be greater than that of an index measure with equal weights assigned to each stock (as depicted in the adjacent chart). Put simply, the headline index measure has often outperformed the average returns of all stocks in the index during certain time periods when large cap stocks dominated the market.
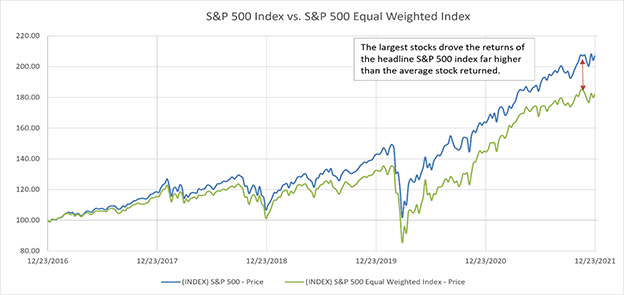
Source: FactSet
But chasing the performance of the biggest companies in the index doesn’t always yield the best results. Sometimes big companies get smaller. And sometimes they even disappear entirely. Consider the list below of the ten largest companies in the S&P 500 in 1983, courtesy of ETF Database.
- IBM
- Exxon
- General Electric
- General Motors
- AT&T
- Standard Oil of Indiana
- Schlumberger
- Sears Roebuck
- Eastman Kodak
- DuPont
Compared to 1983, exactly how prominent are many of those names today? Some have merged with other companies. Others have shrunk to be just shadows of their former selves. And not all of them are even components of today’s S&P 500 index. But they were yesterday’s winners—the stocks which dominated the index’s performance back then after having grown large enough to be considered one of the index’s top ten holdings.
Asking rhetorically, how might have your portfolio have fared if it focused on holding only those stocks since 1983 until now? Yet regardless of whatever stocks you might have hypothetically invested in back then, your portfolio’s performance would have been benchmarked against an index dominated by the performance of these companies.
It also wouldn’t have been very diversified. Owning the top ten stocks in 1983 would mean you would have owned three energy stocks—not surprising given how high oil prices were back then, which contributed to the strong growth of those companies’ market capitalizations. (And then oil prices fell.)
Similarly, owning the top ten stocks of the S&P 500 today wouldn’t be very diversified either, as seen in the table below, courtesy of S&P Dow Jones Indices:
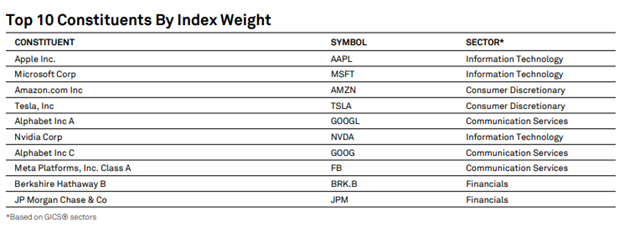
Keep in mind that there are plenty of industries not included in this list. In fact, only four of the eleven broad industry sectors are represented. And just as a reminder, these companies account for more than 30% of both the index’s composition and its performance.
When it comes time to assess how your portfolio is performing, ask yourself—is the S&P 500 necessarily the ‘right’ benchmark to use? Is it really wise to invest your current portfolio in a manner that doesn’t provide broad diversification beyond those industries currently dominating the index? Or without considering how your portfolio might have fared if it were only invested in the dominant companies from decades ago until the present?
Rather than comparing it to the performance of a handful of today’s hottest stocks, there’s a far better metric to gauge how your portfolio is performing. Ask yourself one simple question. “Will I successfully reach my financial goals by investing in a given portfolio that has a risk level with which I am personally comfortable?” That is the only benchmark that should matter. And in fact, it just may serve as your guiding principle for investing in general.
The information contained herein is for informational purposes only and should not be considered investment advice or a recommendation to buy, hold, or sell any types of securities. Indexes cannot be invested in directly, are unmanaged, and do not incur management fees, costs, and expenses. For details on the professional designations displayed herein, including descriptions, minimum requirements, and ongoing education requirements, please visit www.signatureia.com/disclosures.
Signature Investment Advisors, LLC (SIA) is an SEC-registered investment adviser; however, such registration does not imply a certain level of skill or training and no inference to the contrary should be made. Securities offered through Royal Alliance Associates, Inc. member FINRA/SIPC. Investment advisory services offered through SIA. SIA is a subsidiary of SEIA, LLC, 2121 Avenue of the Stars, Suite 1600, Los Angeles, CA 90067, (310) 712-2323, and its investment advisory services are offered independent of Royal Alliance Associates, Inc. Royal Alliance Associates, Inc. is separately owned and other entities and/or marketing names, products or services referenced here are independent of Royal Alliance Associates, Inc.