By Deron McCoy, CFA®, CFP®, CAIA®
Chief Investment Officer
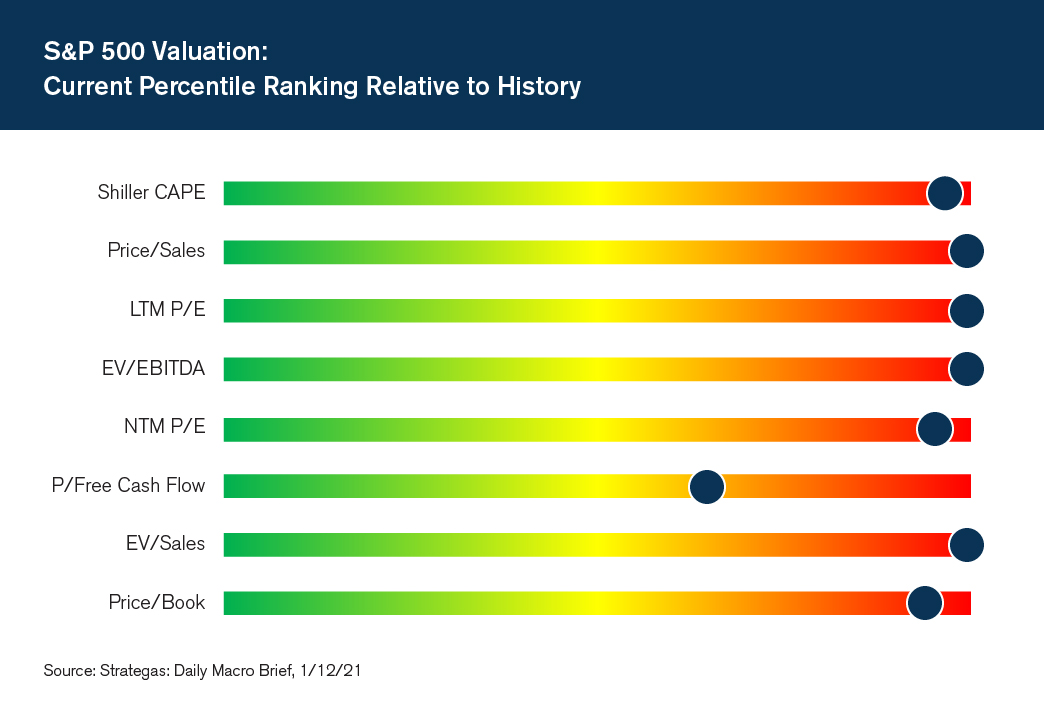
Some are arguing that the stock market is scary expensive with metrics such as Warren Buffet’s Indicator which measures total U.S. market cap to U.S. gross domestic product (GDP), the S&P 500 price-to-sales (P/S) ratio, and the S&P 500 Price-to-Earnings (P/E) ratio all near historic highs. Why is this important? History suggests that when valuations are this high, future forward returns are a lot lower than what many investors have come to expect with some analysts even calling for another lost decade.
Are they right that “the stock market is expensive”? The short answer is yes, well kind of. Actually maybe.
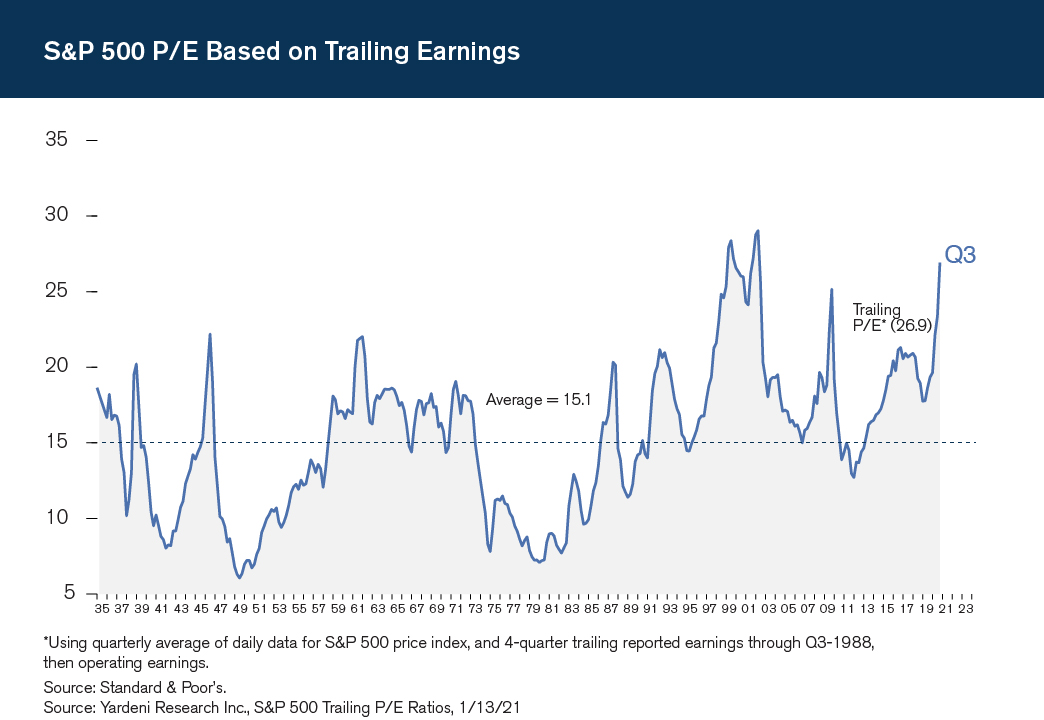
 While the statement is factually true, as with most things in life, the devil is in the details. Valuation metrics do suggest the market is historically expensive, but it’s not as expensive as one might think. If we keep it simple (as possible) and use the more widely known Price/Earnings valuation model, we see that stocks in mid-January (priced around 3800) were trading at about a 28x P/E multiple (we can’t say precisely as earnings for the fourth quarter of 2020 have yet to be announced. See chart for hard data through Q3). That is expensive! But it’s measuring today’s price on last year’s earnings—and earnings in 2020 were terrible, falling around 15%. Most, if not all investors, do not believe 2021 will be a repeat of 2020 with the vaccine rollout and all, so perhaps a better metric would be to value the market on 2021 earnings.
Valuing the market on forward earnings (as opposed to looking backwards to 2020) is logically called a Forward P/E ratio or FP/E for short. When we do the math for 2021, the FP/E falls to the 21-23 range depending on your outlook for earnings growth this year. But those levels are still pushing up towards bubble territory as seen in the second chart (blue line).
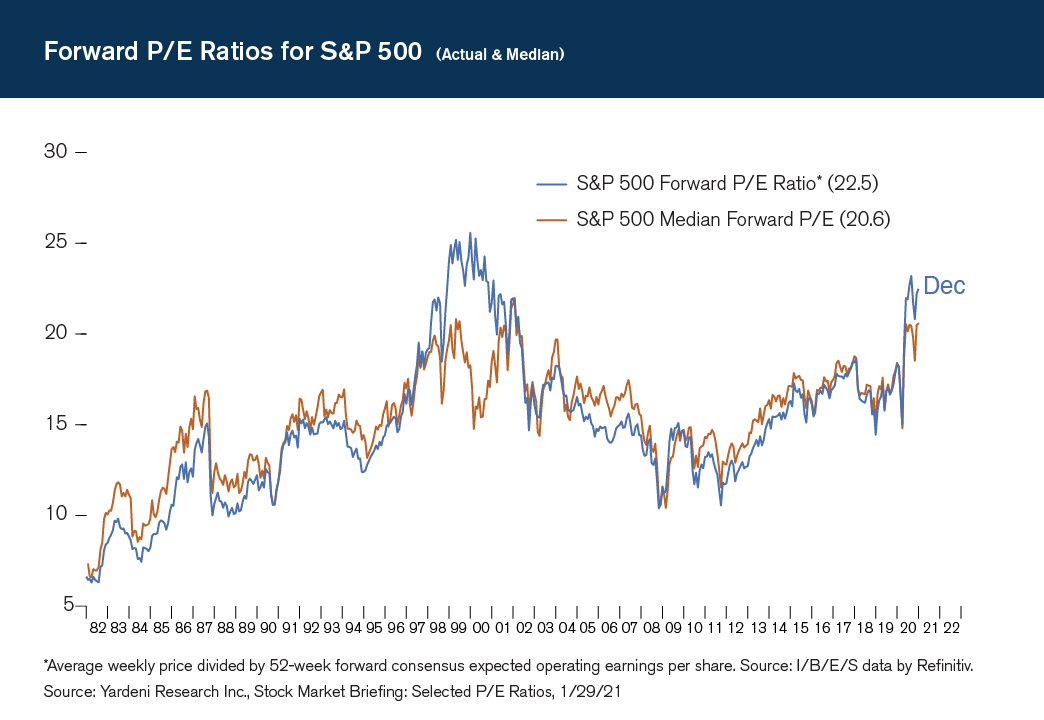
Maybe we can blame it on those trillion-dollar mega cap stocks? Again, if we look at the chart and instead look at the median stock in the S&P 500 (orange line) market valuation still rivals what we saw two decades ago.
Perhaps a more logical analysis would be to instead focus on 2022 earnings. Why should we do this? Well, we believe the current recession is a necessary but self-inflicted one due to the global pandemic. The recession is not a structural problem with the economy, rather an event-driven slowdown not unlike a natural disaster (see Q1 2020 Insights, Lesson 2: The Three Bad Bears – Structural versus Event-driven recessions/bear markets). Natural disasters come through unexpectedly and wreak havoc. Perhaps even temporarily knocking out your home, workplace, or salary. But after the cleanup, life gets back to normal and you get to go back to work earning the same salary or wage that you did prior—and sometimes even more due to some pent-up demand. At the depths of the disaster, you would not want to measure your future worth based on a temporary blip in earnings. Instead, you would need to look to the other side of the valley and realize that life will get back to normal. We believe that is true in the stock market today.
Therefore, investors should not analyze valuations based on 2020 or even 2021 earnings. Life (and corporate earnings) should be back to normal in 2022 or 2023. So instead of using a P/E multiple on the last twelve months (which includes a historic yet temporary global pandemic) or the next twelve months of earnings (the recovery and cleanup), we need to use a forward P/E multiple on the earnings when life is normal—the forward earnings one year in the future or the ‘future forward earnings’ if you will. And on that score, the ‘future forward price/earnings’ or FFP/E comes in around 18-20x which is still elevated according to history but not as mind numbing as some would have you believe.
Ok—I promise, no more math. What is the takeaway? Stocks are not cheap, but they are not so expensive that they should be shunned completely. And if you did, investing is a relative game, and you would need to reallocate elsewhere, and therein lies the rub. Guess what? Everything is expensive! Stocks, Real Estate, Gold, Bitcoin, and yes, bonds too! Government bonds have been bid up so high that they not only sport negative real yields (yields after inflation is taken into consideration) but their prices are subject to reversal as interest rates are poised to move higher as life gets back to normal.
So, what are investors to do?
Fortunately, we can look beyond the S&P 500 to find pockets of under loved and thus undervalued stocks. Everyone loves their tech stocks and the S&P 500 as that has been the major source of profits for the last part of the cycle, but those profits mean increasing share prices which can equate to the same problem we have been discussing—rich valuations. If instead, we seek out Value stocks and venture either down in size or overseas we not only see relatively cheaper stocks but also valuations that are actually on par with their historic norms.
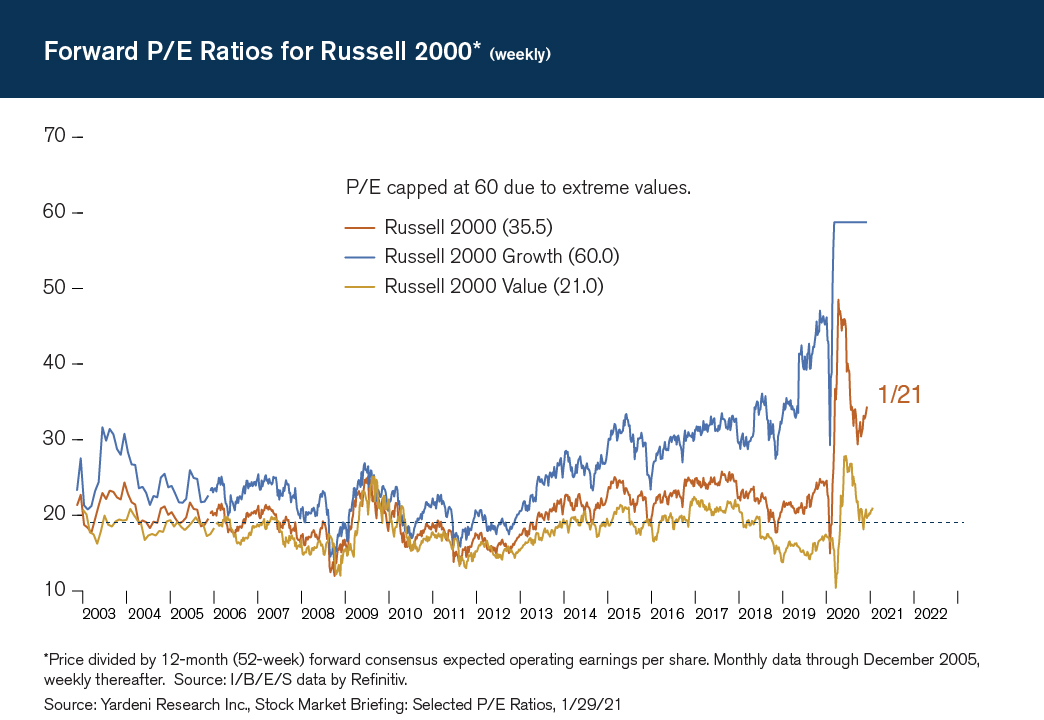
Take Small Cap Value as an example (see gold line in chart). We have added a dotted line to highlight that today’s valuation is actually inline with the last 20 years.
The same is true overseas. When compared to the S&P 500, both Emerging Markets (left) and Developed Markets in Europe, Australasia & Far East (EAFE) both trade at historical discounts.
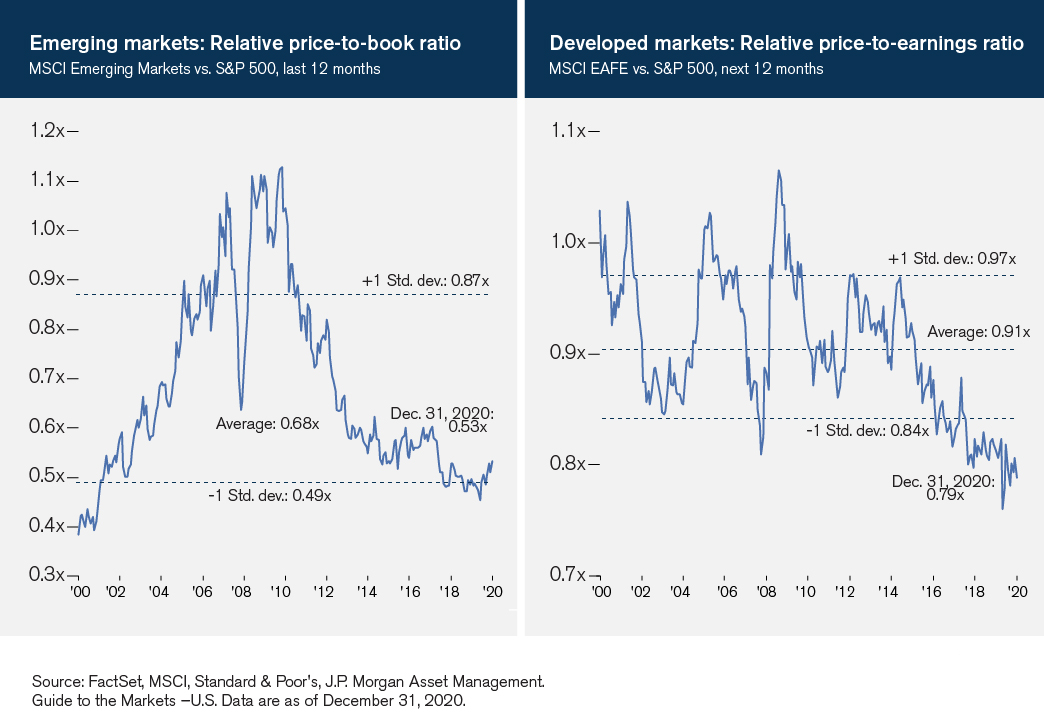
Investors are sure to see scary headlines concerning today’s lofty valuations. And there are certainly frothy speculations in corners of the market. But wise investors will realize that there are pockets around the globe that offer attractive valuations relative to the winners of the last few years.
Past performance is not indicative of future results. Investing involves risk, including loss of principal. Although the information has been gathered from sources believed to be reliable, it cannot be guaranteed. The information contained herein reflects the firm’s views and is subject to change at any time without notice. Views expressed in this article may not reflect the views of Royal Alliance Associates, Inc. Signature Investment Advisors, LLC (SIA) is an SEC-registered investment adviser; however, such registration does not imply a certain level of skill or training and no inference to the contrary should be made. Securities offered through Royal Alliance Associates, Inc. member FINRA/SIPC. Investment advisory services offered through SIA. SIA is a subsidiary of SEIA, LLC, 2121 Avenue of the Stars, Suite 1600, Los Angeles, CA 90067, (310) 712-2323, and its investment advisory services are offered independent of Royal Alliance Associates, Inc. Royal Alliance Associates, Inc. is separately owned and other entities and/or marketing names, products or services referenced here are independent of Royal Alliance Associates, Inc.