By Deron T. McCoy, CFA®, CFP®, CAIA®
Chief Investment Officer
This article was originally published on February 8, 2022. Updated February 18, 2022.
It wasn’t that long ago that markets were trading at all-time highs with the S&P 500® hitting an intraday high of 4818 on January 4th. But stocks sold off over the ensuing 16 trading days pushing the S&P 500 down 11% marking the worst start to a year ever—according to Bloomberg.
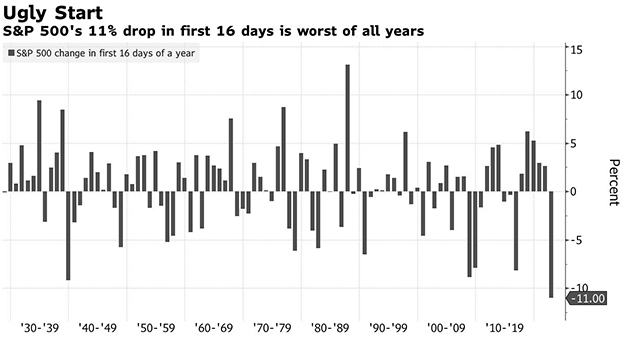
Source: Bloomberg
And stocks have continued to gyrate up and down. Why? Well, there’s certainly plenty to worry about—including but not limited to Covid, Supply Chains, Inflation, the Federal Reserve, Valuations, and excessive margin/leverage (not to mention the upcoming midterm elections as well as geopolitical concerns in Russia and China). Whew! The list is exhausting.
Not surprisingly, global capital markets are reacting. But this is in fact normal; not abnormal. According to JPMorgan, since 1980 intra-year declines have averaged -14%. Yet despite this volatility, the gains have far outpaced the losses and thus the average annual return was +9.4%. Stocks go up, stocks go down—it’s what they do. Volatility is simply the price investors must pay to reap outsized returns.
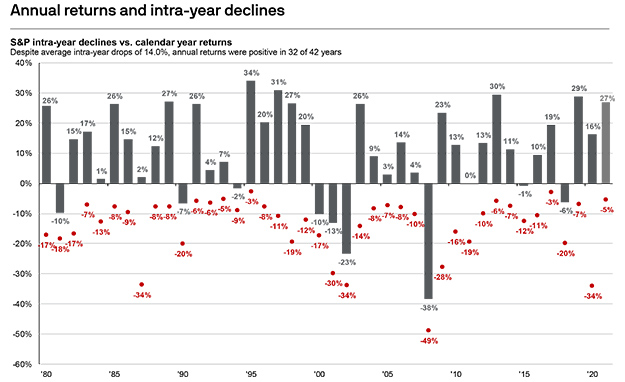
Source: FactSet, Standard & Poor’s, J.P. Morgan Asset Management. Returns are based on price index only and do not include dividends. Intra-year drops refer to the largest market drops from a peak to a trough during the year. For illustrative purposes only. Returns shown are calendar year returns from 1980 to 2021, over which time period the average annual return was 9.4%. Guide to the Markets – U.S. Data as of December 31, 2021.
Although history suggests that markets can certainly go lower, it’s important to remember that real long-term wealth is often generated in these times of stress. Intestinal fortitude and a good financial plan can help ensure that you don’t sell (or are forced to sell) at the bottom; but instead have the means to take advantage of volatility—seeking out opportunities in the weeks and months ahead.
So when might this bout of volatility come to an end? No one really knows. But perhaps we tackle each of the present concerns within our proprietary GISMO (Growth, Inflation & Interest Rates, Sentiment, Markets, Outlook) framework to glean some possible outcomes.
Covid (Economic ‘Growth’): For investors, the concerns around Covid center on whether the virus will cause lockdowns or restrictions, and thus crimp growth via the economy and corporate earnings. The preliminary news last month from South Africa and the United Kingdom concluded that while the spread was massive, the severity of the illness was less so—which would allow economic growth to continue despite the ongoing pandemic. In short, no recession.
And now various economic data points are confirming this thesis. One juggernaut of economic activity is Housing Starts. According to Bespoke Investment Group, “in terms of the business cycle, Housing Starts have historically peaked well in advance of recessions, so with the current 12-month average of Housing Starts at its highest levels since April 2007, the outlook for the economy appears positive.”
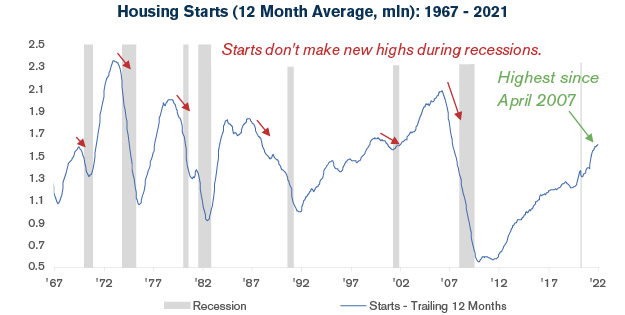
Source: Bespoke Investment Group
Supply Chains, the Federal Reserve (‘Inflation and Interest Rates’): There are many different aspects and causes to today’s high level of inflation. But to simplify: a lack of labor (covid quarantines, job quits or early retirement, etc.) has caused a backlog in global supply chains that has reduced the supply of goods available to consumers. Meanwhile, the combination of pent-up spending power (due to lockdowns, restrictions, etc.) along with excessive stimulus, has produced ever increasing demand for items. Any Econ 101 student knows that if Demand is greater than Supply, then prices (inflation) rise. And here we are. But now, the Federal Reserve’s mandate to keep prices stable is pushing them to not only end Quantitative Easing but to also raise interest rates and reduce their Balance Sheet via Quantitative Tightening. In short, we’re now in an era of tighter monetary policy—so expect a higher interest rate environment. But this is good news. More normal interest rate levels in the short term can help prevent a multi-year period of near double-digit inflation in the future. In short, slow down a bit now to avoid slamming on the brakes later on down the road. And markets believe the Fed will win. According to analysts at Deutsche Bank, “the Fed’s hawkishness is already making an impact as forward inflation expectations are down -27bps year-to-date and -43bps from seven-year highs reached back in October.” The battle against long-term inflation is now underway, and interest rates should move higher—and this landscape will have a near-term impact on both sentiment and stock valuations.
Valuations, Excessive Margin, & Leverage (‘Sentiment’): It’s really fairly simple. History suggests that in periods of high inflation, stock valuations tend to be lower. And in periods of moderate inflation, valuations push higher. This was the case recently. For the bulk of 2020-21, the S&P 500 traded at a 21x price-to-projected-earnings multiple. Stocks rose, but so did future earnings projections. So even as prices moved ever higher, the price-to-earnings ratio remained roughly the same. But pre-pandemic and pre-emergency stimulus, stocks traded at lower valuations (around an 18x multiple). So, if we’re moving away from emergency monetary stimulus, while at the same time massive fiscal stimulus is waning, then markets should probably trade back to those pre-pandemic valuations as well. And from here, it’s just math.
Remember, we aren’t forecasting a recession so earnings may continue to grow to ~$225 in 2022 (current consensus estimates according to I/B/E/S and FirstCall). Using a pre-pandemic valuation multiple (18x) equates to the S&P 500 trading in the 4050 range—or roughly an additional 5% lower. Recall, the average annual intra-year decline is 14% so this additional move lower would put us in the range of an average decline.
‘Sentiment’ has many forms, and some metrics take a more touchy-feely approach rather than the math-centric approach above. Investors can gauge market inflection points based on how investors feel. But this is a contrarian indicator. When everyone feels bullish, they have already bought their stocks—leaving very few investors remaining to buy more stocks and push prices higher. Conversely, if everyone’s bearish, they may have already sold—thus few new sellers in the future. This touchy-feely approach can actually be tracked by analytics either via what investors say (Net Bullish Sentiment Survey) or what they do (the Put/Call Ratio reflecting investor trades and positioning). And there is some good news on both fronts, as fear in the marketplace has increased to a point that (using history as our guide) a market low may be near. Again, to confirm previous thoughts, we may be closer to the end of this selloff than the beginning.
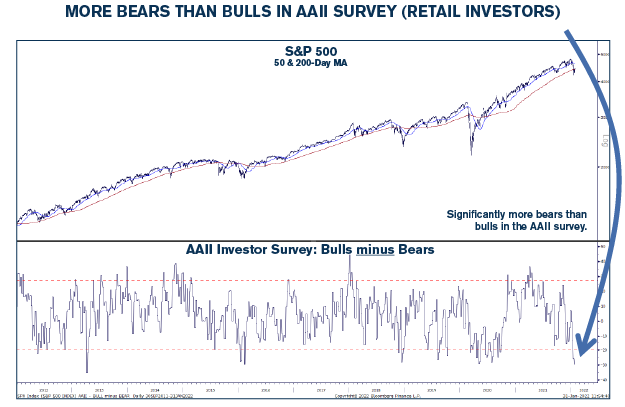
Source: Strategas
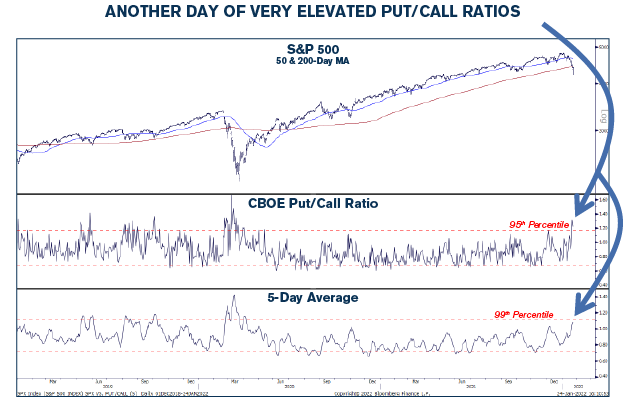
Source: Strategas
‘Markets’: The ‘M’ in GISMO is ‘Markets’ and investors can glean a sense of where the economy is headed by reading the tea leaves of the market itself. Sometimes stocks sell-off due to longer-term problems with a deteriorating economy or recession. But sometimes the selloffs are more temporary in nature. Investors must analyze whether we’re headed to recession and something more sinister, or whether this is a temporary pause in an economic expansion and an ongoing bull market. A vital component to a healthy economy is that corporations have easy and readily available access to credit. And we can measure this liquidity by analyzing credit spreads in the High Yield market. In times of real stress, high yield spreads widen out—making access to credit more difficult. But according to Bespoke Investment Group, the current environment is relatively benign. They add that the adjacent chart “shows the change in high yield spreads during the first 5% of each S&P 500 sell-off from a record high during the post-Global Financial Crisis period. Performance in the high yield market during this selloff and the one prior (September 2021) has stood out relative to prior pullbacks in that, while high yield spreads typically widen out, they have done next to nothing during the first 5% decline of the last two selloffs. This suggests that the current sell-offs are more to do with a repricing due to valuations than underlying weakness in the credit markets.”
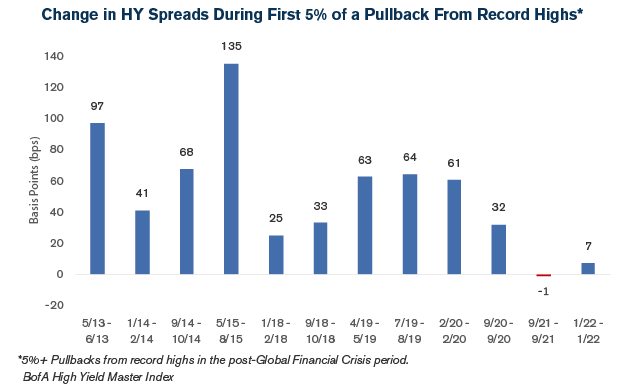
Source: Bespoke Investment Group
The takeaway? At this point in time, markets are not suggesting real economic pain in the coming quarters. The resulting selloff, therefore, may be more benign than one tied to a recession.
‘Outlook’: The first four metrics of our framework suggest that diversified long-term investors can remain bullish (while those investors concentrated in the fads and bubbles of 2021 may need to consult our recent publication, “This Time it’s Different” and/or “Time to Change”). However, the ‘O’ or ‘Outlook’ is designed to try and capture events outside the near-term landscape—events that may alter plans in the quarters ahead. And here, the news is more mixed in the near term.
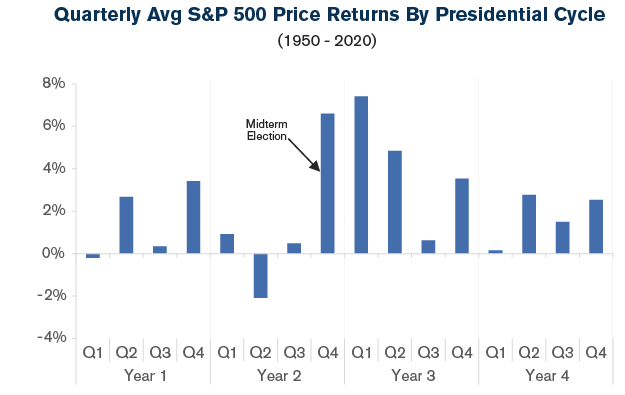
Staying stateside, 2022 is another year where politics will take center stage with the upcoming midterm elections in November. Unfortunately, according to Strategas Research Partners, year two of the presidential cycle is the worst year for investors (with most of the pain concentrated in Q2). And an analysis out of Bespoke suggests that the median decline for the S&P 500 approaches -18%; or down another -7% from recent levels.
Source: Bespoke Investment Group
Overseas, things don’t seem to be much better. The ongoing turmoil with China and the increased tensions with Russia don’t appear to be ending anytime soon. According to Bespoke, “financial markets are pricing a high likelihood of conflict as Russian asset prices collapse under the expectations of aggressive sanctions in response to any invasion (including cutting Russia off from USD assets and blockades of key imports like semiconductors).” But fortunately, market turbulence around geopolitical events has typically been good buying opportunities.
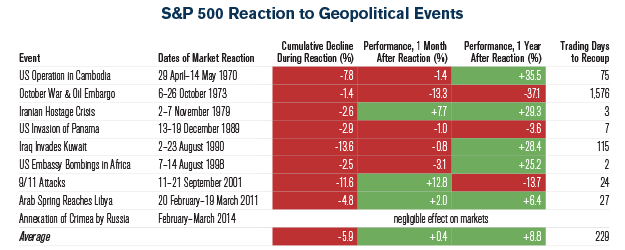
Source: SSGA Research, Bloomberg. Past performance is not a guarantee of future results.
Perhaps we may need more clarity before an all-clear signal is given—but that clarity may be coming. For everyone’s safety and sanity, we’ll hopefully finally get some clarity on Covid during this third year of the pandemic. That would be great and well received. Nonetheless, over the next several quarters we should get a clearer picture of an improving supply chain, the peak and subsequent rollover in inflation, and thus a more tepid response from the Fed. All of which should boost asset prices. We may also get some clarity from Moscow, Beijing, and the make-up of Congress in Washington DC—which history suggests should provide a massive tailwind to financial markets. The ensuing 270 days after the November election has historically been the best period for stocks in the presidential cycle!
Source: Strategas
Investors can take solace that while the current landscape is less than ideal, several metrics seem to suggest that the selloff may be closer to the end than the beginning—not to mention that there are major tailwinds in the back half of this year that could propel stocks to new highs. Also, potential headwinds can be turned on their head if investors take advantage of these changing landscapes by including both bonds and stocks that do well in a higher inflationary and higher interest rate environment. Investors would be wise to include ‘unfixed income’ in their bond allocations, as well as Value stocks on the other side of the ledger—not to mention a sound financial plan that won’t make you a forced seller should 2022 indeed have something more sinister in store for us.
The information contained herein is for informational purposes only and should not be considered investment advice or a recommendation to buy, hold, or sell any types of securities. Financial markets are volatile and all types of investment vehicles, including “low-risk” strategies involve investment risk, including the potential loss of principal. Past performance does not guarantee future results. There is no guarantee that a diversified portfolio will outperform a non-diversified portfolio in any given market environment; it is a method used to help manage investment risk. Indexes cannot be invested in directly, are unmanaged, and do not incur management fees, costs, and expenses. For details on the professional designations displayed herein, including descriptions, minimum requirements, and ongoing education requirements, please visit signatureia.com/disclosures.
Signature Investment Advisors, LLC (SIA) is an SEC-registered investment adviser; however, such registration does not imply a certain level of skill or training and no inference to the contrary should be made. Securities offered through Royal Alliance Associates, Inc. member FINRA/SIPC. Investment advisory services offered through SIA. SIA is a subsidiary of SEIA, LLC, 2121 Avenue of the Stars, Suite 1600, Los Angeles, CA 90067, (310) 712-2323, and its investment advisory services are offered independent of Royal Alliance Associates, Inc. Royal Alliance Associates, Inc. is separately owned and other entities and/or marketing names, products or services referenced here are independent of Royal Alliance Associates, Inc.