By Gene Balas, CFA®
Investment Strategist
Many media pundits have been quick to say we’re on a path to 1970s-style stagflation. While clearly we’re experiencing the impact of high inflation in many aspects of everyday life (not just in government statistics), I would very much question the assumption that economic stagnation is on the immediate horizon.
Not only is the U.S. economy still experiencing strong growth, but it is growing strongly relative to its overall long-term potential growth rate. What do I mean by that? The current long-term potential growth rate of our economy is quite a bit less than it was during the 1970s—meaning that less growth now has a greater impact than greater growth would have had back in the 1970s.
To better understand this concept, let’s first look at what our economy’s potential growth rate is (i.e., how fast it needs to grow for people to become better off), without being too slow that we have a recession, or too fast that we have even more inflation. This will depend on how many more people are in the labor force each year, and how much more per hour they’re producing. As a mathematical formula, this would be represented as:
Growth of the Labor Force + Productivity Gains = Potential Growth Rate of the Economy
If the population is aging and the labor force is growing more slowly (as is the case now — unlike the 1970s), we would reasonably expect a slower-growing economy. Likewise, if there are abundant technological advances which can propel productivity gains that allow workers to produce more in less time, those workers, in turn, can be paid more per hour without sparking inflation.
A quick look back
In terms of the actual real (net of inflation) growth of the economy, how did the 1970s fare compared to the economy’s long-term potential growth rate? Based on historical annual data from 1950 through 2021, the average difference between our economy’s actual real GDP vs. its potential GDP has been just 0.02%[i].
But from 1974 through 1982—the period often noted for high inflation and slow economic growth (and which included three recessions)—the average annual difference between real economic growth (measured by GDP) and the economy’s potential growth was -1.13%. That result was even worse than mere stagnation.
Actual GDP growth during the 1970s was less than its potential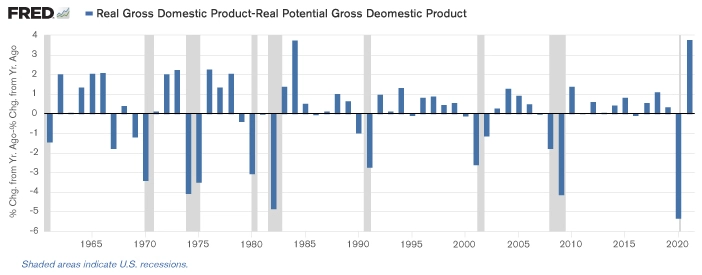
Source: CBO; BEA
Are we once again nearing (or at) that point, simply because we now have high inflation? Actual GDP growth in 2021 was 5.7% versus the economy’s potential growth rate of 1.9%. That’s a +3.8% difference—hardly a stagnant economy by any measure!
But considering that inflation feels very real to most Americans while GDP growth doesn’t, how is this impacting people’s pocketbooks? Here again, we see that Americans generally have been better off during recent years, as indicated on the adjacent graph of real median personal incomes (i.e., the inflation-adjusted income where half of people earn more than the median and half earn less). Using the median (rather than the average) removes distortions of very high-income households skewing the income numbers higher. Also, note that this particular data series doesn’t have as long of a history.
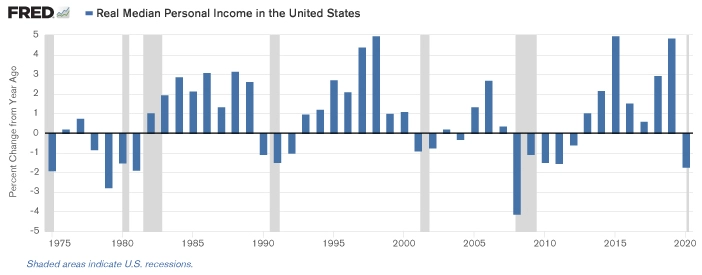
Source: U.S. Census Bureau
Clearly the annual percent changes in personal incomes, adjusted for inflation, were negative during the 1970s. But so too were they during the slow recovery following the Great Financial Crisis. In the latter case, however, this was due to slow wage growth rather than high inflation. Conversely, in more recent years, inflation-adjusted wage growth has been much more notably positive—except, of course, for the pandemic-distorted year of 2020.
We can also examine the current environment vs historical periods through the ‘Misery Index’—a measure of the combined unemployment rate and inflation rate. Created by renowned economist Arthur Okun, this index offers a simple way to quantify the economic hardships Americans face. Again, however, we don’t see the current environment equating to the 1970s—when the Misery Index was much higher than at any point in recent history.
The Misery Index: The Sum of the Unemployment Rate Plus Inflation (as measured by the CPI)[ii]
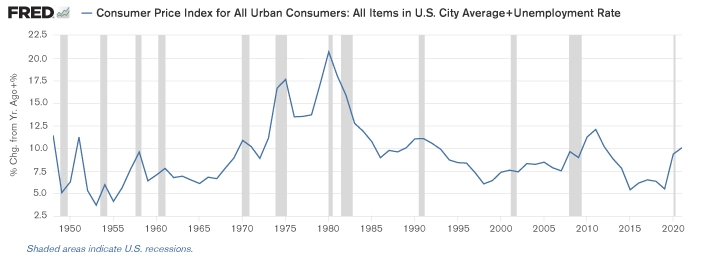
Source: U.S. Bureau of Labor Statistics
Yes, the Misery Index has indeed risen of late. But it has not yet surpassed levels seen following prior recessions in 1990 or after the Great Financial Crisis. Additionally, these more recent post-recession highs in the Misery Index appear to be due more to higher unemployment rather than high inflation.
What’s different in the current environment?
The key difference between the pain of what we’re currently experiencing and what we’ve seen in earlier decades comes down to two basic factors:
- the “surprise” of how suddenly inflation materialized; and
- the fact that many (or even most) Americans don’t remember the inflation of past decades and thus, high inflation is a very foreign concept, outside the realm of recent experience.
Certainly, we’re all familiar with elevated unemployment levels going back over the past couple decades or so. But even with high unemployment rates, most people in the labor force remain working. Yet everyone, employed or not, is faced with paying higher prices. Inflation, therefore, is a broadly acute problem—with everyone worse off.
The adjacent graph illustrates just how sudden of a spike recent inflation has been—and how much greater inflation is now than it has been over the past several decades. For those of us (including myself) who remember the rampant inflation of the 1970s and 1980s, however, this current acceleration might not be such an entirely foreign concept.
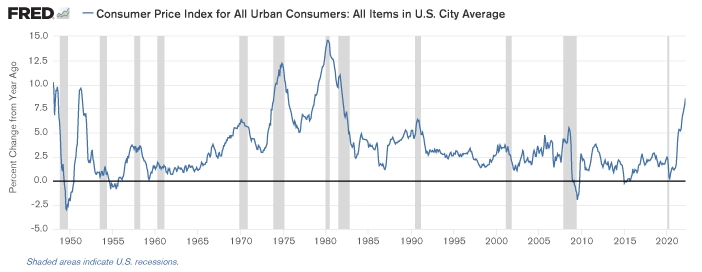
Source: U.S. Bureau of Labor Statistics
But compared to the 1970s-style stagflation, our current bout with inflation has not coincided with elements of a stagnant, moribund economy. Given record-low unemployment rates and household balance sheets that are, on average, flush with cash (courtesy of the various pandemic federal fiscal stimulus programs), it’s difficult to make a compelling case for stagflation. Inflation, yes, certainly.
But remember, part of the reason why we have such high inflation now is due to very strong consumer demand, fueled by low interest rates from monetary stimulus and ample cash from fiscal stimulus—all running headlong into supply chain disruptions and commodity shortages, partly due to the Russia-Ukraine war. This is an entirely different scenario than in the 1970s, which began with the oil embargo sparked by the Arab-Israel war that then led to a wage-price spiral. Excessive consumer demand most definitely was not a cause of the high inflation back then.
History is an excellent teacher. And in this instance, it reminds us that the inflationary pain we are currently experiencing is a far cry from the stagflation pain we experienced decades ago, when economic conditions were much worse than they are today.
[i] Data for the actual rate of GDP growth is from the U.S. Bureau of Economic Analysis, while the data for the potential GDP growth rate is from the Congressional Budget Office.
[ii] Data for both the unemployment rate and the consumer price index for all urban consumers (CPI) are provided by the U.S. Bureau of Labor Statistics.
The information contained herein is for informational purposes only and should not be considered investment advice or a recommendation to buy, hold, or sell any types of securities. Financial markets are volatile and all types of investment vehicles, including “low-risk” strategies, involve investment risk, including the potential loss of principal. Past performance does not guarantee future results. For details on the professional designations displayed herein, including descriptions, minimum requirements, and ongoing education requirements, please visit signatureia.com/disclosures. Signature Investment Advisors, LLC (“SIA”) is an SEC-registered investment adviser; however, such registration does not imply a certain level of skill or training and no inference to the contrary should be made. Securities offered through Royal Alliance Associates, Inc. member FINRA/SIPC. Investment advisory services offered through SIA. SIA is a subsidiary of SEIA, LLC, 2121 Avenue of the Stars, Suite 1600, Los Angeles, CA 90067, 310-712-2323, and its investment advisory services are offered independent of Royal Alliance Associates, Inc. Royal Alliance Associates, Inc. is separately owned and other entities and/or marketing names, products or services referenced here are independent of Royal Alliance Associates, Inc.