By Howard Chen, AIF®, CMFC®
Director of Investment Services
The financial markets do not like uncertainty. And there has been no shortage of uncertainty being introduced to the markets this year, leaving a pit in most investors’ stomachs. COVID-19 (Coronavirus) is likely to be front and center as world powers grapple with taming the spread of this new threat. The Russia-Saudi oil price war caused the New York Stock Exchange to halt trading for 15 minutes after stocks shed more than 7% shortly after US markets opened for trading Monday morning (3/9/2020). In January this year, tensions between the US and Iran had reached its most strained point in decades when Washington blamed an Iranian-backed militia for the death of an American contractor and bombed bases associated with the group in response. While in the U.K., Harry and Meghan, the Duke and Duchess of Sussex announced their decision to “step back” as senior members of the Royal Family sending shockwaves through international media as “Megxit” ensued.[1]
It is no secret that investors also do not like uncertainty. The volatility that investors are experiencing is manifesting itself in investors wanting to “do something” about it. Questions about when the best time to get in and out of the market start arising. Often, the best move for all long-term investors is to stay invested. Investors who stayed put had experienced annualized returns of 5.6% if they were invested in the S&P 500 from 1999-2018. By just missing the top 10 days within that period, annualized returns for investors would have dropped to 2% annualized. If investors missed the top 40 days, annualized returns would have been -4.2%.
Time in the market is more important than timing the market
Index annualized total return (1999-2018)
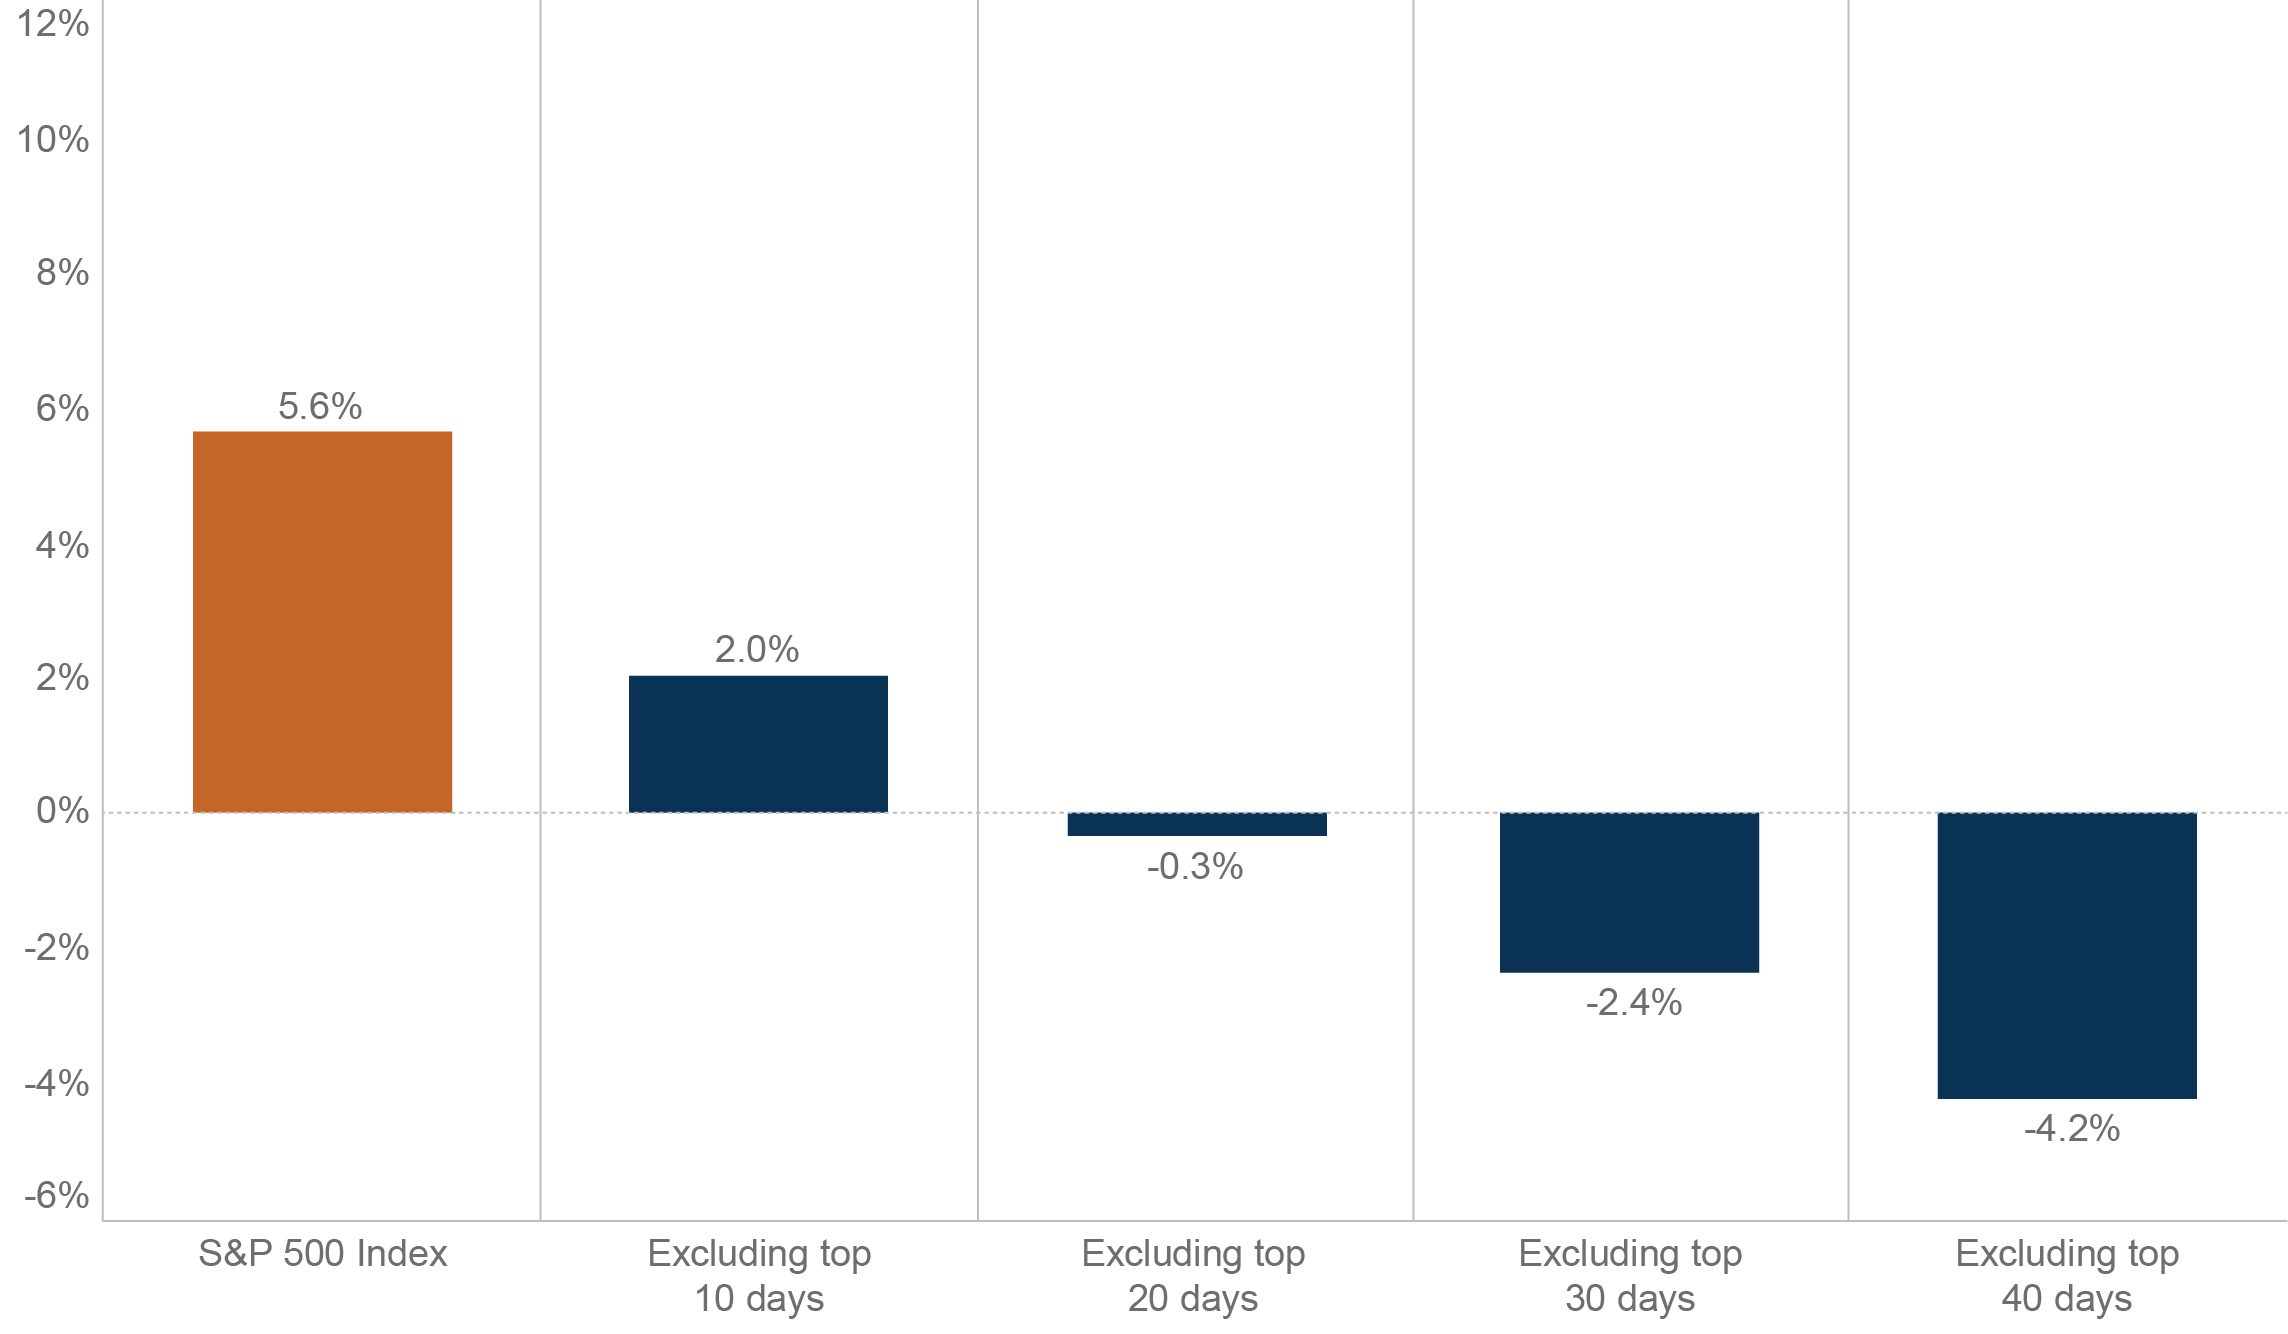
Source: Schwab Center for Financial Research with data provided by Standard and Poor’s. Return data is annualized based on an average of 252 trading days within a calendar year. The year begins on the first trading day in January and ends on the last trading day of December, and daily total returns were used. Returns assume reinvestment of dividends. When out of the market, cash is not invested. Market returns are represented by the S&P 500 Index which represents an index of widely traded stocks (orange bar). Top days are defined as the best performing days of the S&P 500 during the twenty-year period. Indices are unmanaged, do not incur fees or expenses, and cannot be invested in directly. Past performance is no indication of future results. © 2019 Charles Schwab & Co., Inc. All rights reserved.
Between 1999 and 2018, the financial markets, as well as investors, had survived the September 11th terrorist attacks in 2001, US invading Iraq in 2003, 2008 financial crises (also known as the global financial crises), US debt downgrade by the Standard & Poor’s rating agency in 2011, and Brexit in 2016, all the while returning 5.6% annualized returns. The financial markets have proven itself to be resilient throughout history. There has always been uncertainty and a reason for investors to sell and get back in later, but history has shown that time in the market has paid off for the long-term investor.
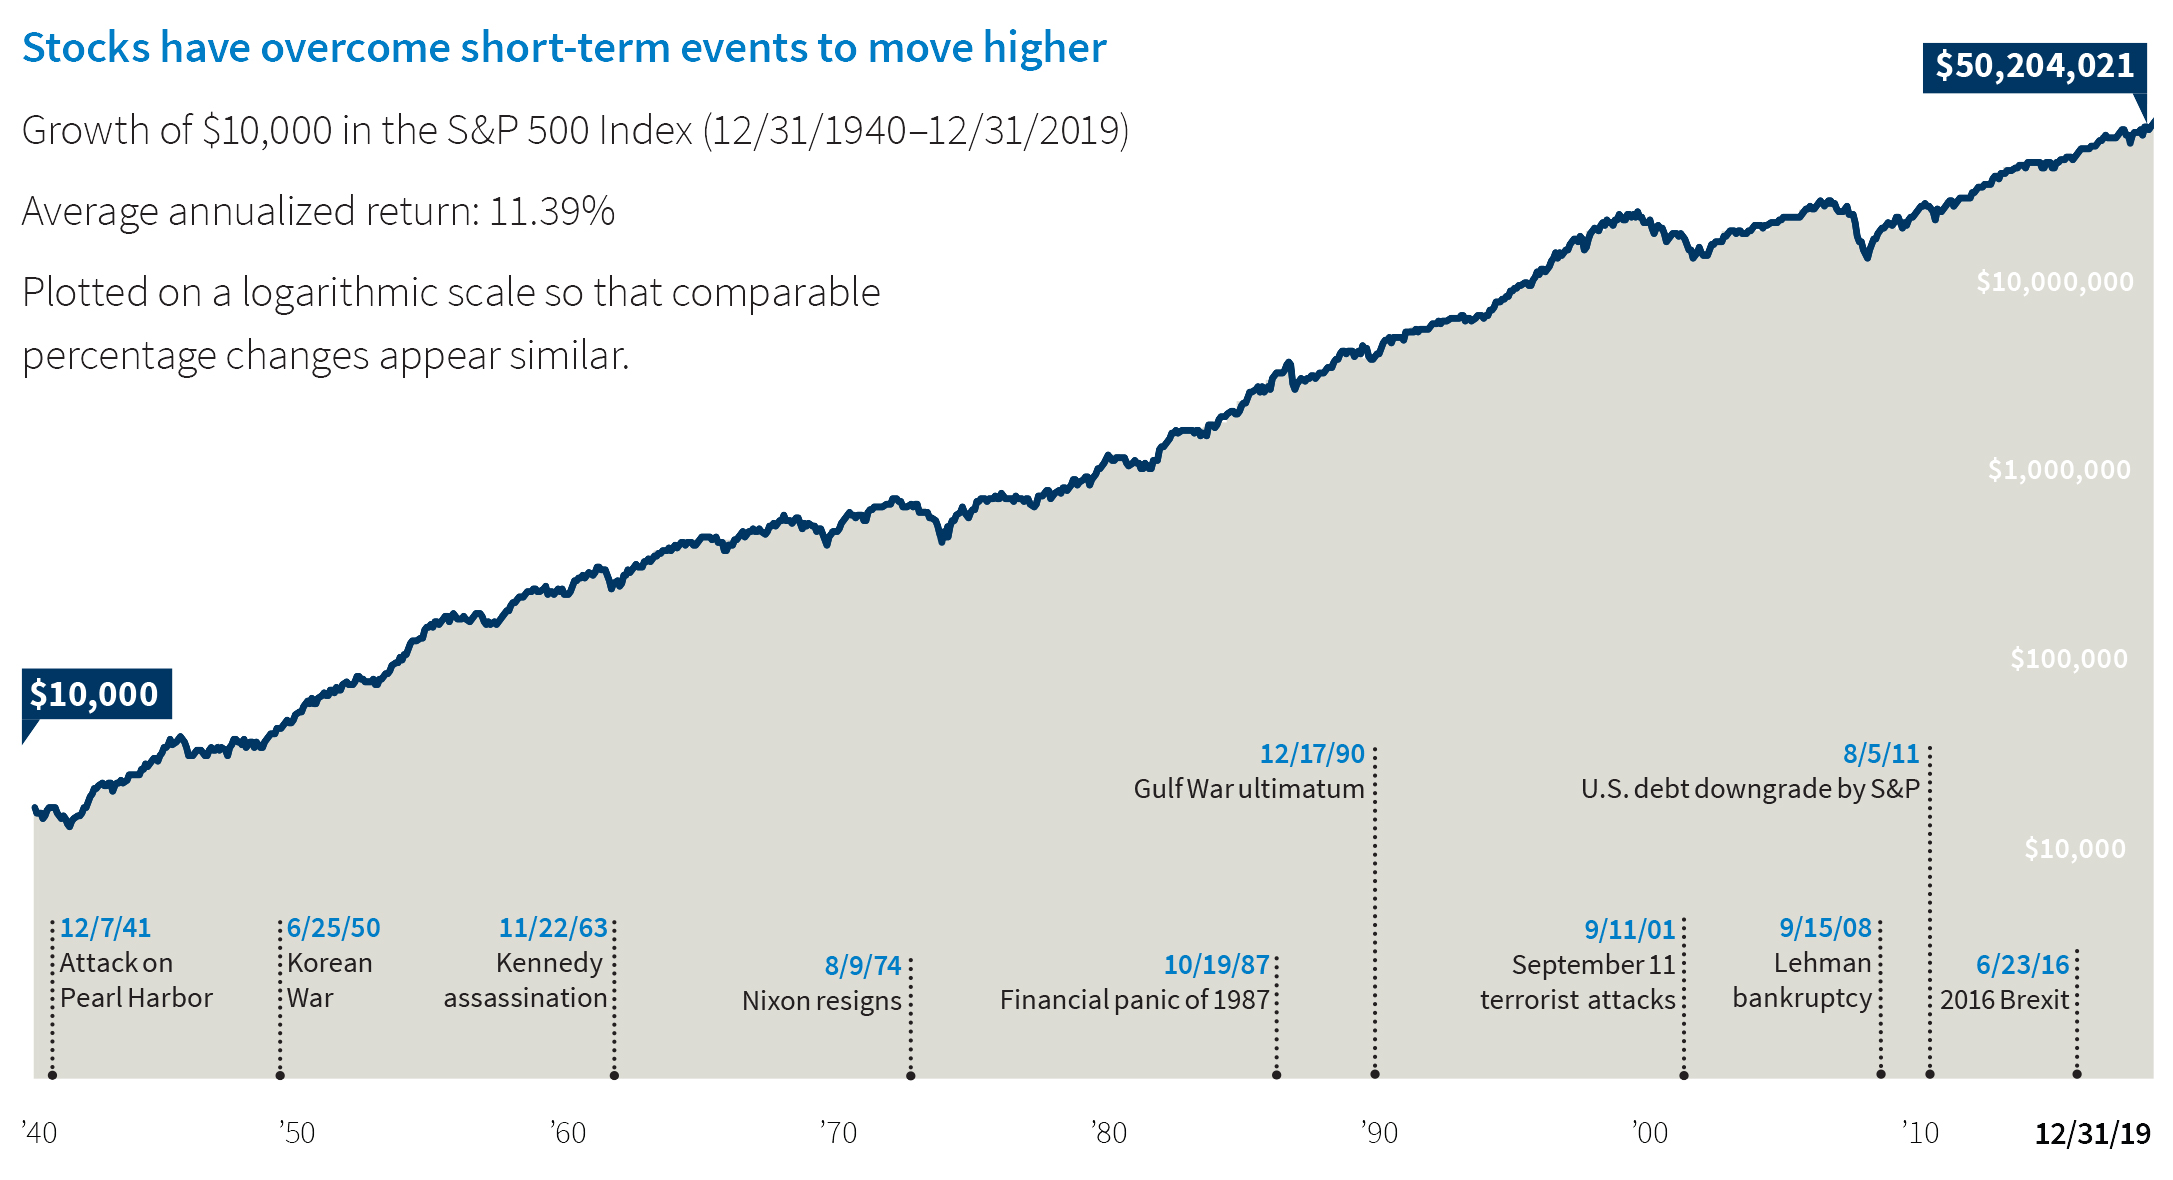
Source: Putnam Investments. This graph represents a hypothetical $10,000 investment in the S&P 500 Index, an unmanaged index of common stock performance. You cannot invest directly in an index. Indexes do not have sales charges and do not represent the performance of any Putnam fund or product. Past performance does not indicate future results, and prior markets may not be duplicated. Systematic or continued investing does not assure a profit or protect against loss. You should consider your ability to continue investing during periods of low price levels. The time horizon shown here is longer than that of most investors.
In 2018, US equities (S&P 500) had the worst year since the 2008 financial crises. Equity markets around the world sold off with concerns of a slowing global economy and tightening monetary policy. If investors who invested in the S&P 500 just stayed invested the whole year, they would have lost 4.4% for the year. By missing only the top 10 highest returning days of the year, the 4.4% loss plummeted to a 23.7% loss for the year.
Time in the market is more important than timing the market
Index total return (2018)
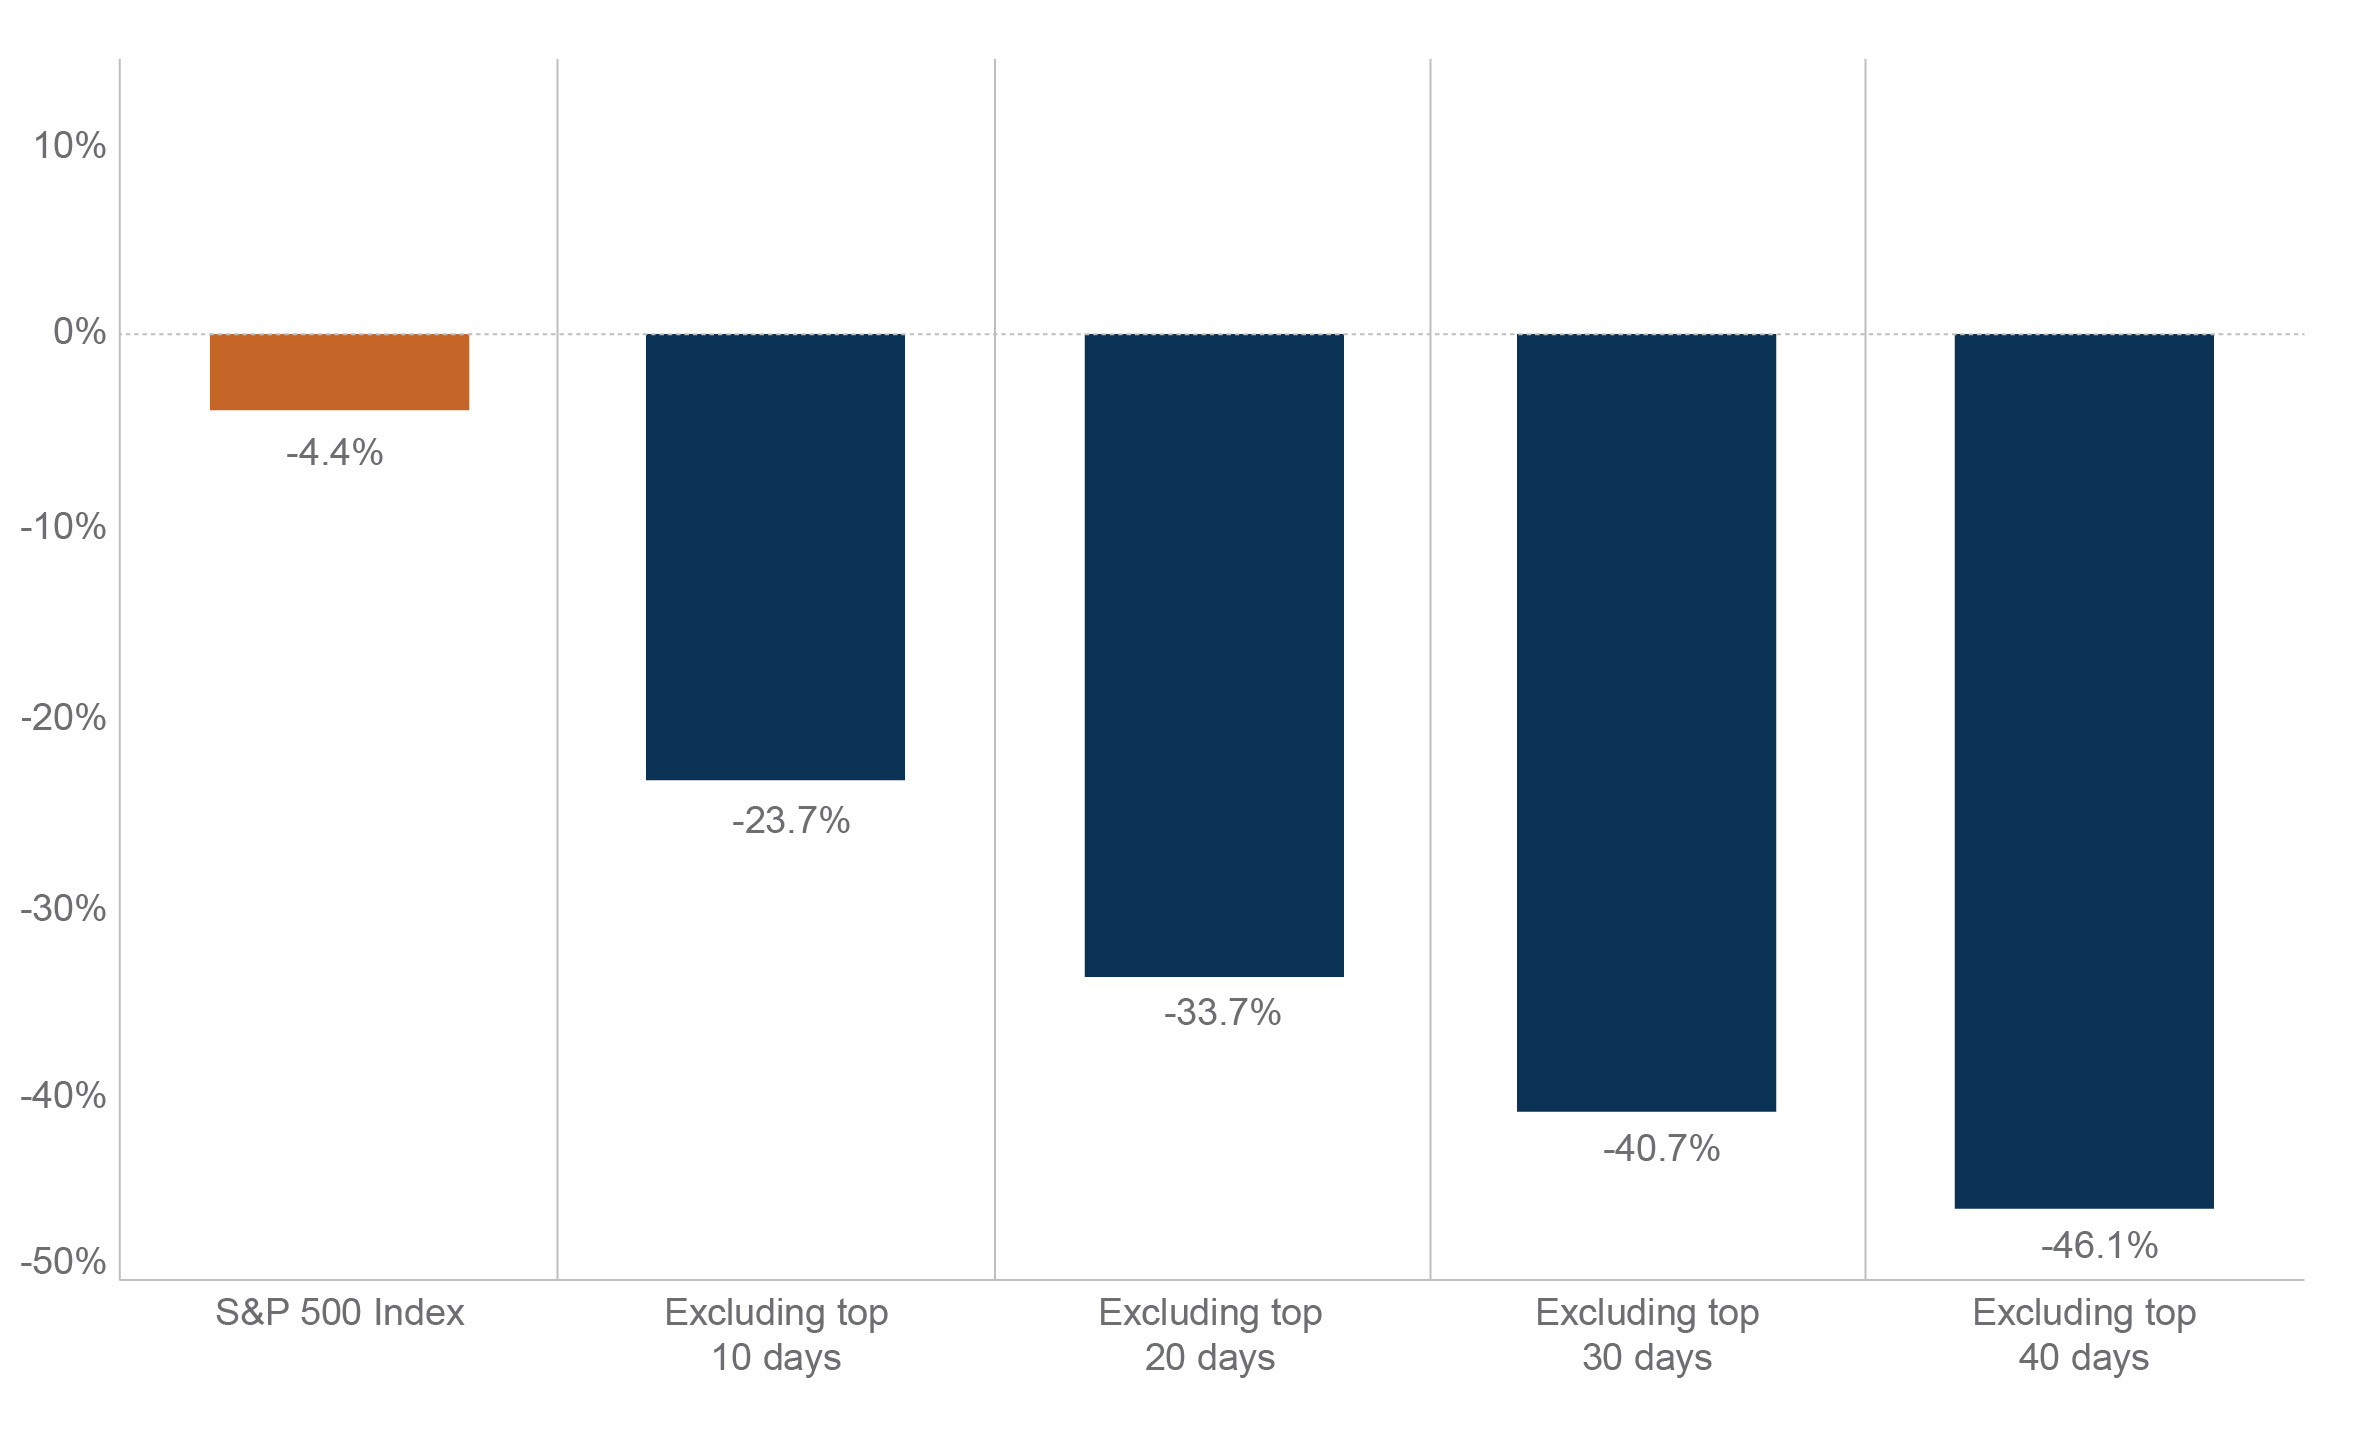
Source: Schwab Center for Financial Research with data provided by Standard and Poor’s. Return data is annualized based on 252 trading days within a calendar year. The year begins on the first trading day in January and ends on the last trading day of December, and daily total returns were used. Returns assume reinvestment of dividends. When out of the market, cash is not invested. Market returns are represented by the S&P 500 Index which represents an index of widely traded stocks (orange bar). Top days are defined as the best performing days of the S&P 500 during 2018. Indices are unmanaged, do not incur fees or expenses, and cannot be invested in directly. Past performance is no indication of future results. © 2019 Charles Schwab & Co., Inc. All rights reserved.
Best Way to Get Through This: Making a Plan and Sticking to It
Remember that pit in the investor’s stomach? That is our fight or flight response engaging. This response has helped us respond rapidly to external threats against survival. It worked out great for the survival of humanity, but when it comes to investing this inclination can also be our worst enemy as this same fear may drive us away from the markets at the worst times. The solution to combating that fear is to develop a plan that should include things you can control, such as the following:
- Revisit your asset allocation – How do you feel about risk? Are you okay with a greater amount of up and down movement in your portfolio for potentially higher returns? Or would you prefer more stability in your portfolio even if it means having lower returns?
- Revisit your financial goals – Your portfolio’s risk profile should also match your financial goals. How close to retirement are you? Are your annual cash flow needs being met? What should be done to help reach those cash flow needs?
- Don’t try to time the market, just invest time in the market – Missing a few key days in the market can affect your long-term returns. Market and economic downturns will happen and are ultimately not in our control, however, a well-designed plan alongside a commitment to achieving your long-term goals is.
[1] https://nas/content/staging/seia.bbc.com/news/world-51067450
Investing involves risk including the potential loss of principal. No investment strategy can guarantee a profit or protect against loss. Past performance is no guarantee of future results. Please note that individual situations can vary. Therefore, the information presented here should only be relied upon when coordinated with individual professional advice. Securities offered through Royal Alliance Associates, Inc. member FINRA/SIPC. Investment advisory services offered through SIA, LLC. SIA, LLC is a subsidiary of SEIA, LLC, 2121 Avenue of the Stars, Suite 1600, Los Angeles, CA 90067, (310) 712-2323, and its investment advisory services are offered independent of Royal Alliance Associates, Inc. Royal Alliance Associates, Inc. is separately owned and other entities and/or marketing names, products or services referenced here are independent of Royal Alliance Associates, Inc.