By Sam Miller, CFA®, CFP®, CAIA®
Senior Investment Strategist
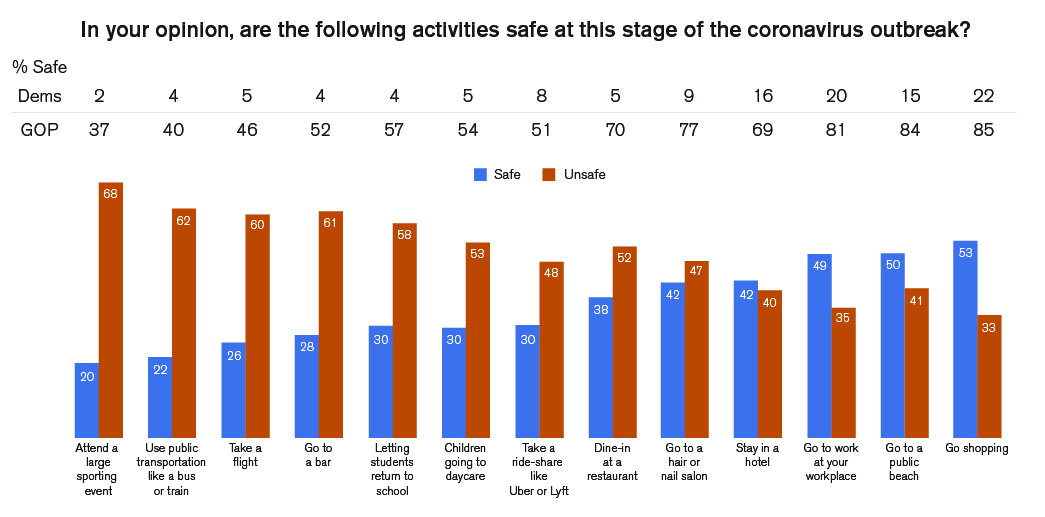
Having just passed the midpoint of 2020, the year has already staked its claim as one for the history books – a year that for many reasons most of us will remember for the rest of our lives. But in addition to the ongoing coronavirus pandemic, associated economic challenges, and civil unrest, the presidential election is fast approaching. In a day and age where emotions can run high and seemingly every issue can be divided along party lines (see Exhibit 1), it’s particularly important to remove any embedded political bias when making important decisions, especially when it comes to your portfolio. So, let’s assess where we are today, and look to history as a guide for how markets may respond to the upcoming election (exploring bull/bear cases for either a Trump re-election or a Biden election.)
Exhibit 1: Divide between right and left as it relates to views on COVID-19[1]
Where do we stand today?
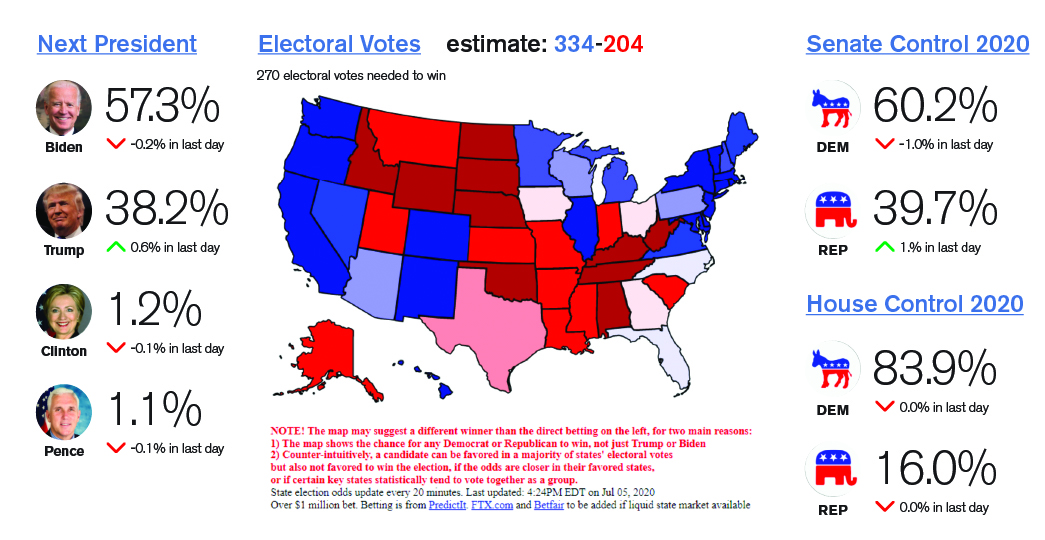
As of mid-2020, President Trump’s chances at re-election have taken a hit. While Trump held a steady lead through April and May, the tide turned in June as civil unrest flared up around the country and now Biden holds an 18-point lead according to Real Clear Politics (Exhibit 2). A similar picture applies to Republicans more broadly, according to the website electionbettingodds.com (Exhibit 3), as Democrats have opened up a sizable lead for both the Senate and the House. However, given everything that has transpired over the last few months, we need no reminder that anything can happen between now and election day.
Exhibit 2: Trump vs Biden[2]
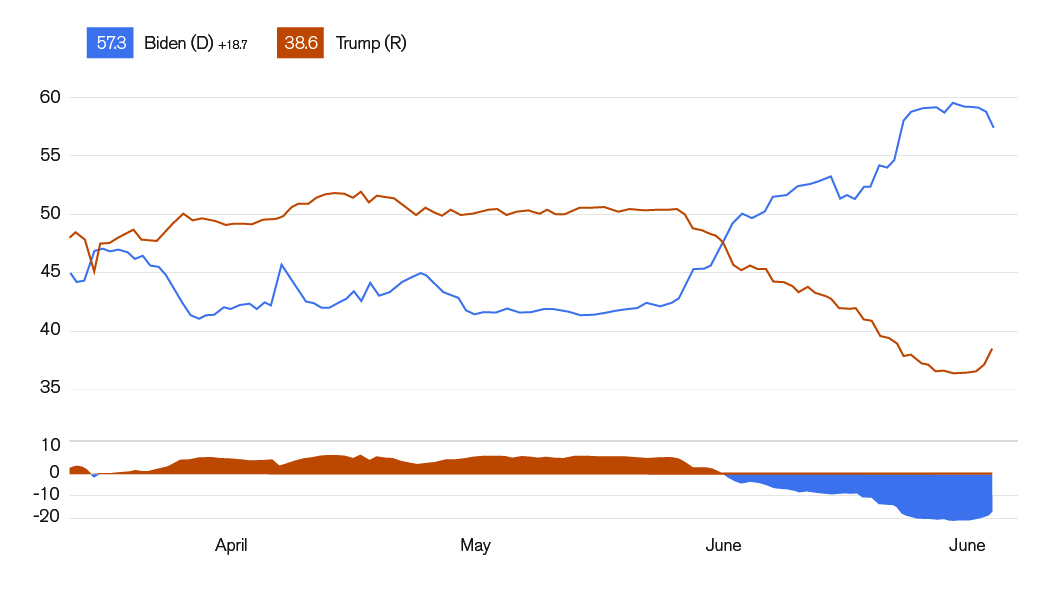
Exhibit 3: Election Betting Odds[3]
What does history have to say about the path forward for markets?
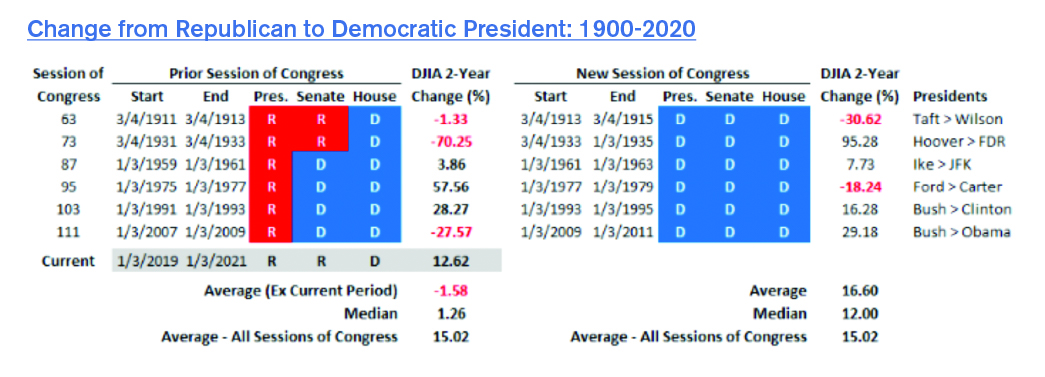
Going back to 1900, there have been six prior periods where control of the White House transferred from the Republican to Democrat party. Exhibit 4 shows each of those periods along with corresponding Dow Jones (DJIA) performance for the two-year session of Congress prior to and after the administration change. Notably, on average the DJIA had been negative (-1.58%) in the two years leading up to the election. Those prior periods of weak market performance stand in contrast to today’s stronger market, with a DJIA gain of 12.62% for this session of Congress as of June 2. During the subsequent two years after an administration change, the DJIA averaged a 16.6% return, slightly better than the 15.02% average return experienced across all sessions of Congress.
Exhibit 4: Change of Republican to Democratic President: 1900-2020[4]
Historically, the stock market has been a solid predictor of election outcomes. Since 1928, the S&P 500® has predicted 87% of U.S. presidential election winners, and every winner since 1984. If the S&P 500 is positive in the three months leading up to the election, the incumbent party has won, and if stocks are lower, the opposition party has won (Exhibit 5).
Exhibit 5: S&P 500 Index Performance 3 Months Before A Presidential Election[5]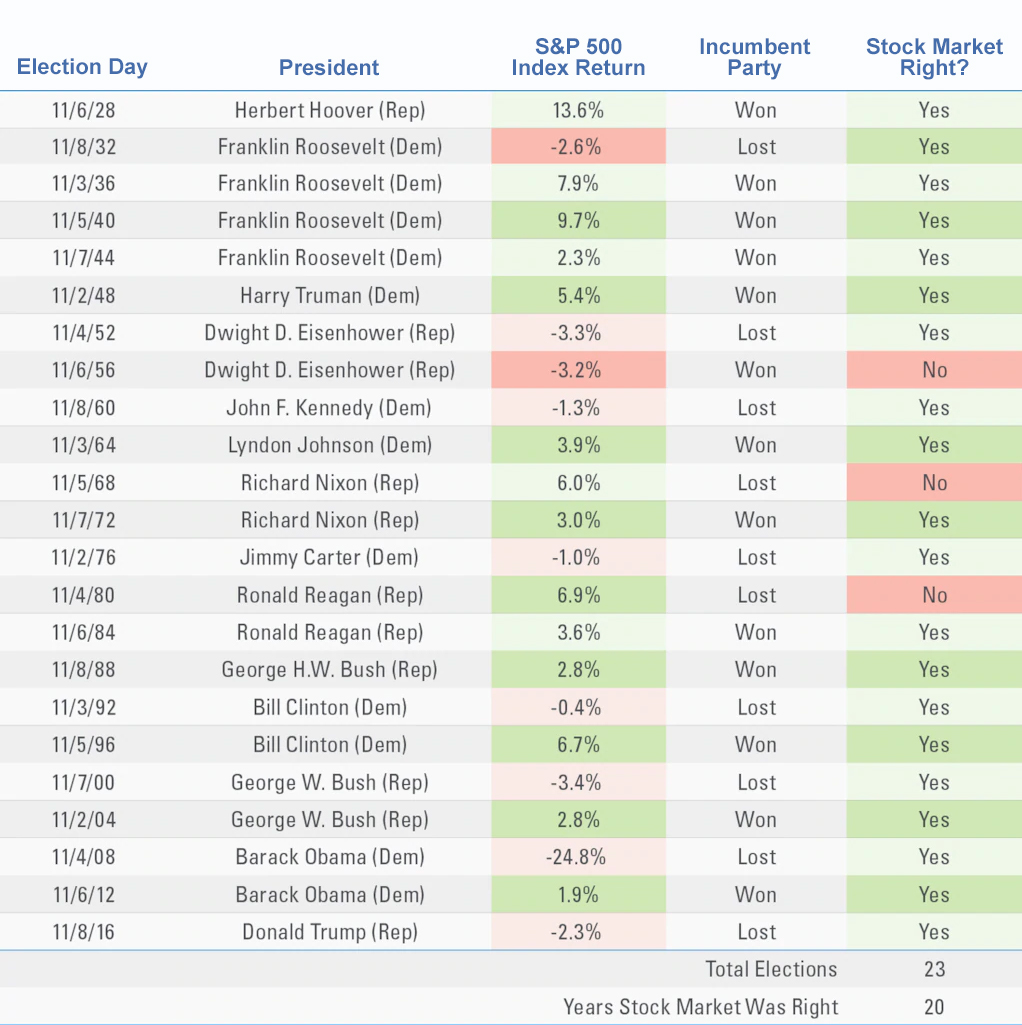
What are the implications of a Biden presidency?
Some of the potential outcomes of a Biden presidency include an increase in the federal corporate income tax rate from 21% to 28%, along with higher personal taxes on upper income earners. While the market may not react favorably to higher tax rates (and in particular companies that benefit most from lower taxes), other policies he puts forth might be met with less resistance by the market. These might include a de-escalation of the trade war and better prospects for international cooperation on issues such as climate change.
In previous election cycles, wins by Democrat candidates have been associated with strong performance in categories such as utilities, real estate, staples, and health care. Beyond those typical sectors, a large infrastructure package has a higher probability of passing in the event of a Democrat sweep. This could boost the prospects of companies associated with highway, transit, rail, water, green energy, and broadband spending. Conversely, in addition to the companies that would be most hurt by higher tax rates, defense stocks could conceivably suffer should Democrats sweep.
On the other hand, a Trump re-election would likely benefit Defense and Aerospace stocks, as Republicans typically keep defense spending higher. Materials and Financials would benefit from continued deregulation and tax cuts, and the “For Profit” sector would see continued enforcement of immigration policy aiding prisons and deregulation of lenders helping the education system.
In the coming months, many pundits on both sides of the aisle will draw on a host of reasons (many of which will be anchored to some cognitive bias) to claim that a Democrat/Republican administration will be better/worse for the stock market and economy. While it would be naïve to believe that Presidents and administrations don’t have an impact on financial markets, the economy itself is much bigger and more complex than any single person or group of people. Markets are driven by a multitude of factors and the collective action of millions of individuals and institutions based on their specific needs, thoughts, and judgements – and increasingly by programmed computer algorithms.
Investors often gain confidence if their candidate wins, or lose confidence if their candidate loses, and allow those emotions to alter their investment portfolios. In fact, the National Bureau of Economic Research found that after the 2016 election, Republicans increased their exposure to U.S. stocks, while Democrats increased their relative holdings of bonds and cash.[6] In hindsight, a more unbiased perspective would have clearly benefited Democrat investors. It’s yet another reminder to avoid investing, or making changes to your investment strategy, based on emotions or impulse. The best approach remains to stick with your investment plan based on your long-term goals, and stay disciplined and patient in the process.
[1] Change Research
[2] Real Clear Politics
[3] Electionbettingodds.com
[4] Bespoke
[5] LPL Research, Strategas
[6] NBER
This material is for informational purposes only and is not intended as individual investment advice or as a recommendation of any particular security, strategy, or investment product. Investment decisions should be made based on the client’s specific financial needs, objectives, goals, time horizon and risk tolerance. Financial markets are volatile and all types of investment vehicles, including “low-risk” strategies involve investment risk; Past performance does not guarantee future results. Indices and benchmarks references herein are unmanaged and cannot be invested in directly. Investment return will be reduced by the investment advisory fees and any other expenses that the client may incur in the management of an investment advisory account. Signature Investment Advisors, LLC (SIA) is an SEC-registered investment adviser; however, such registration does not imply a certain level of skill or training and no inference to the contrary should be made. Securities offered through Royal Alliance Associates, Inc. (RAA) member FINRA/SIPC. Investment advisory services offered through SIA, LLC. SIA, LLC is a subsidiary of SEIA, LLC, 2121 Avenue of the Stars, Suite 1600, Los Angeles, CA 90067, (310) 712-2323, and its investment advisory services are offered independent of RAA. RAA is separately owned and other entities and/or marketing names, products or services referenced here are independent of RAA.